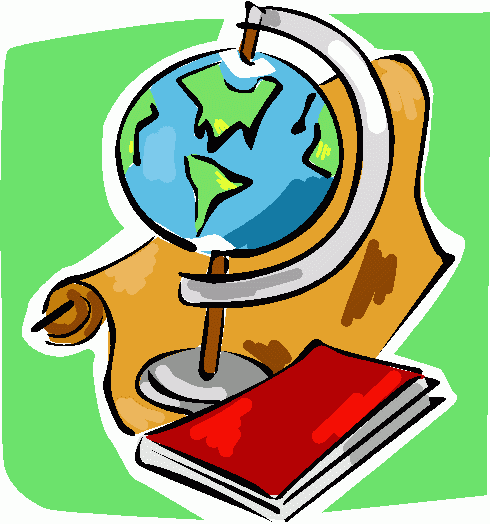
Map Clipart
Maps have been used for thousands of years to help people navigate and understand the world around them. From basic sketches to detailed atlases, maps provide visual representations of geographic information. Modern digital mapping allows us to map the entire globe and zoom in to street level detail.
Types of Maps
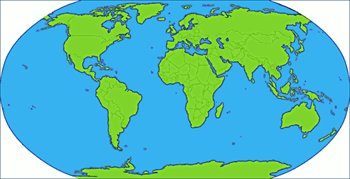
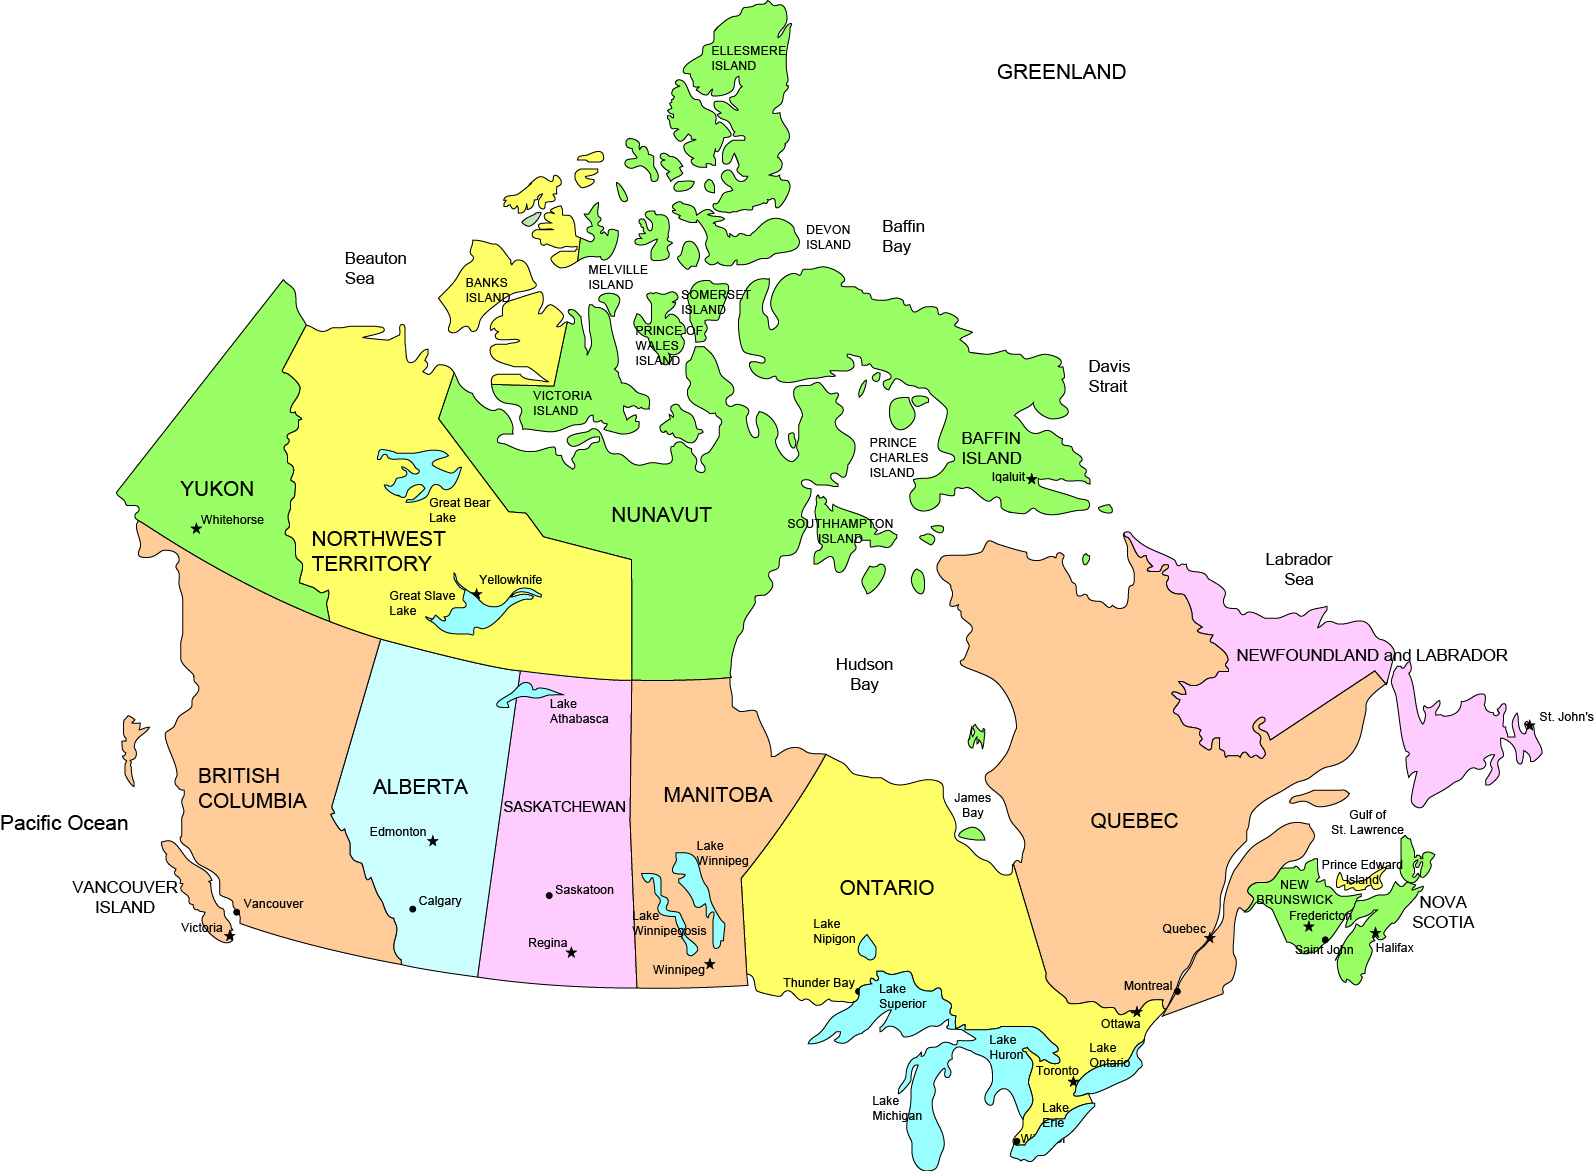
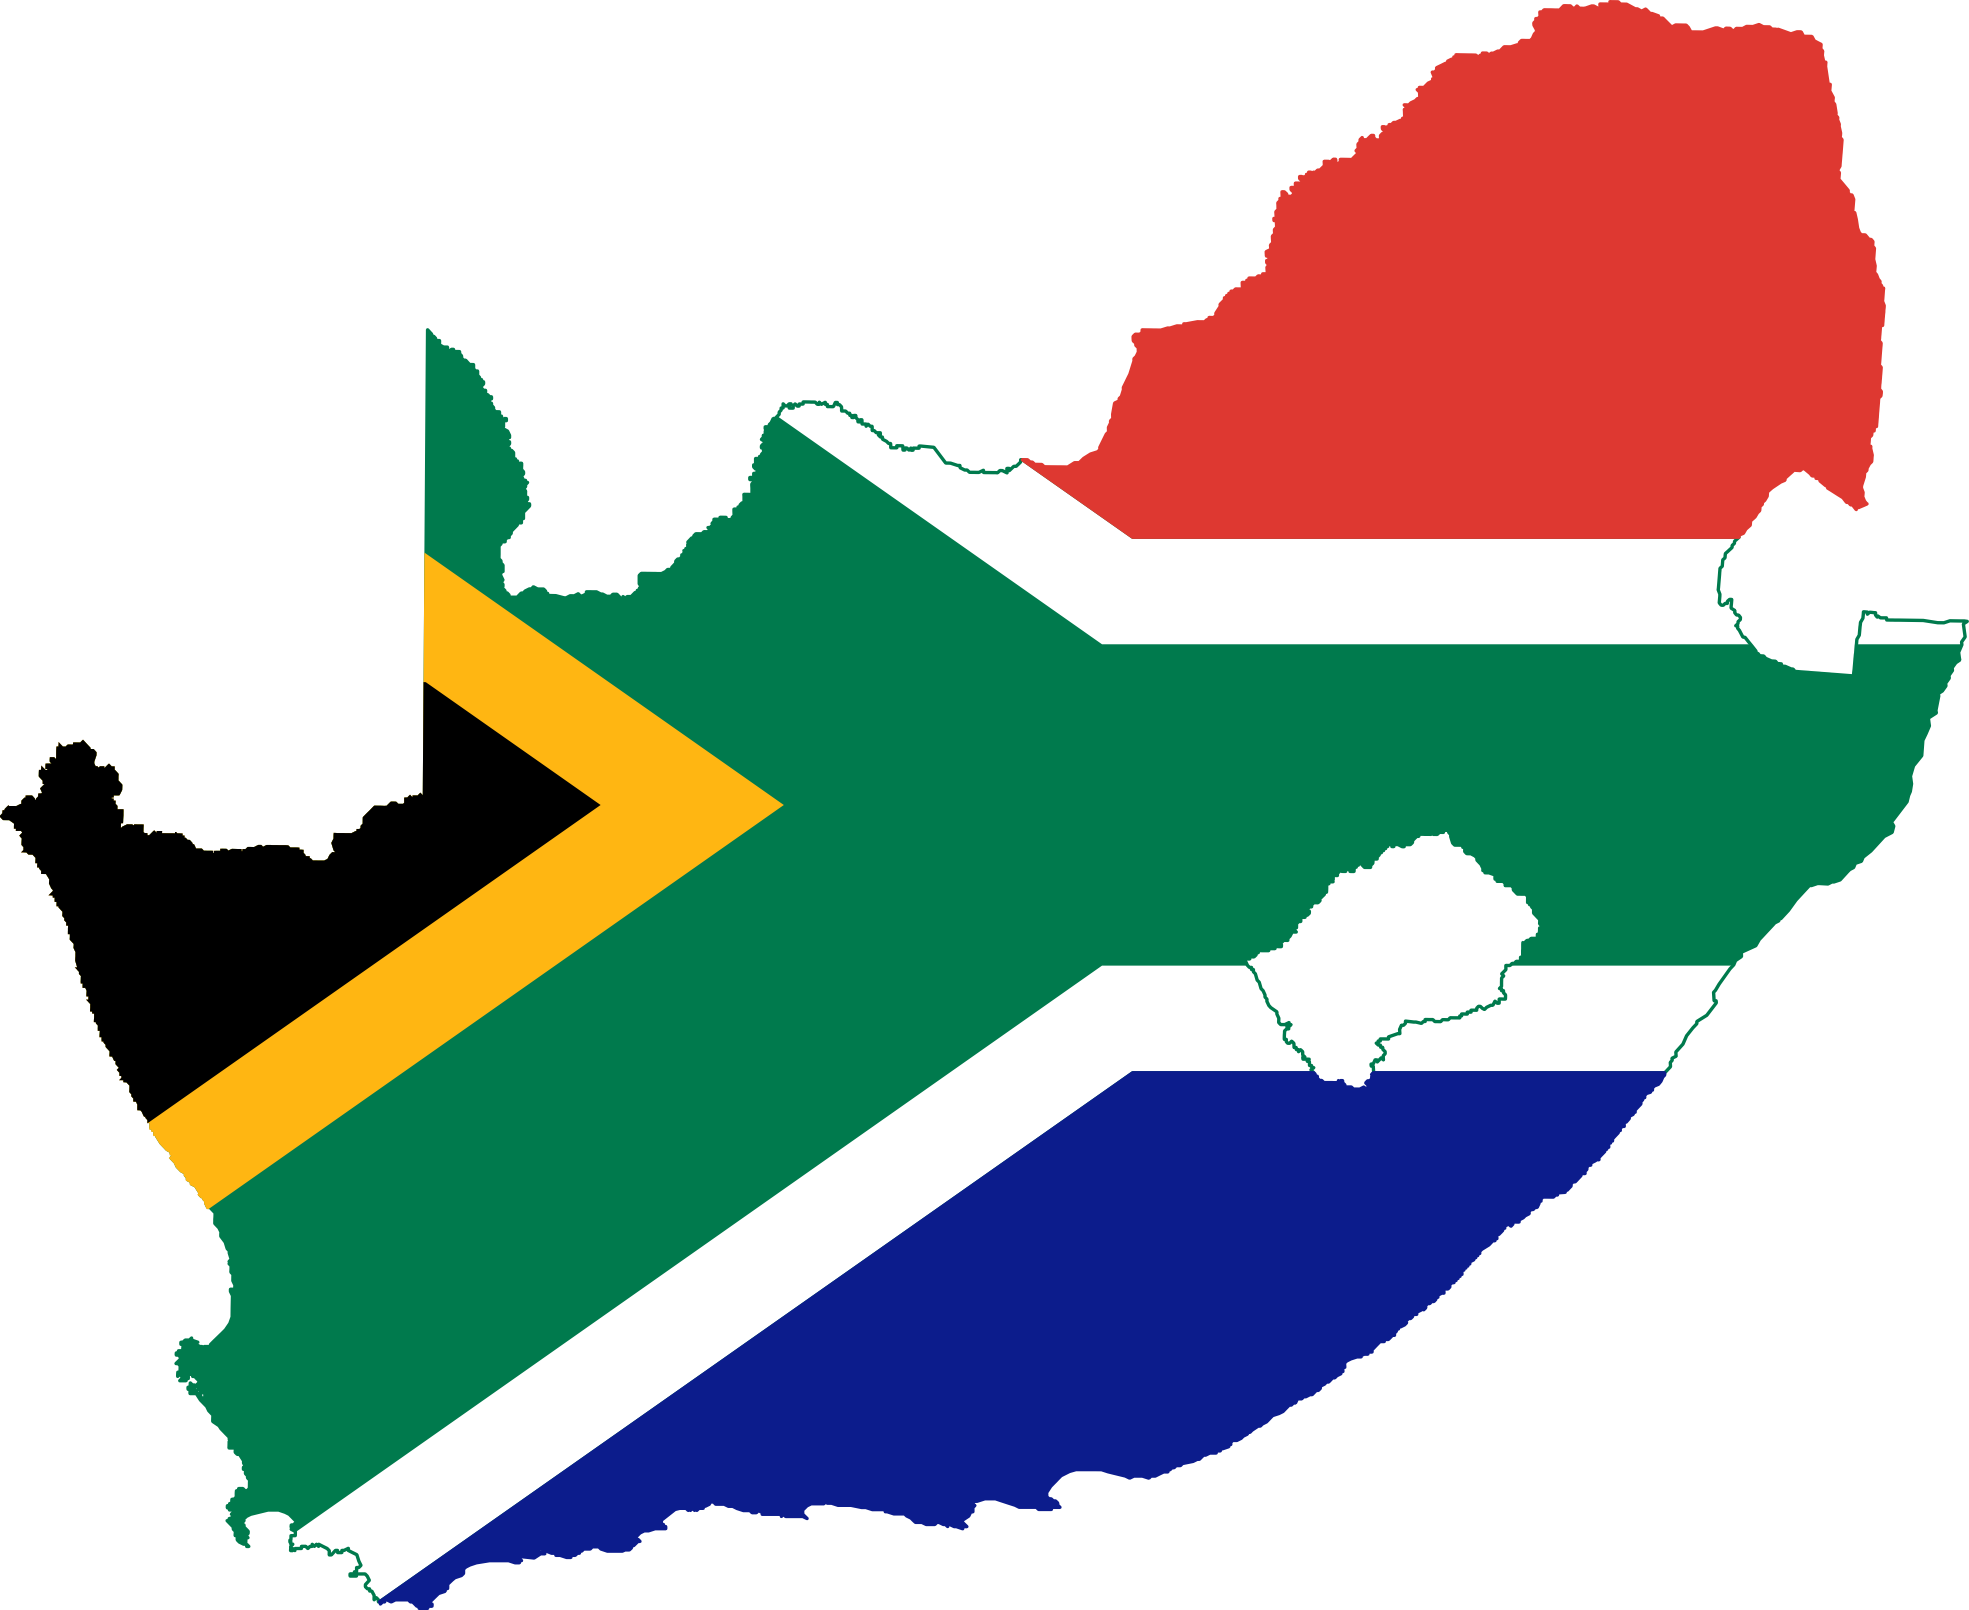
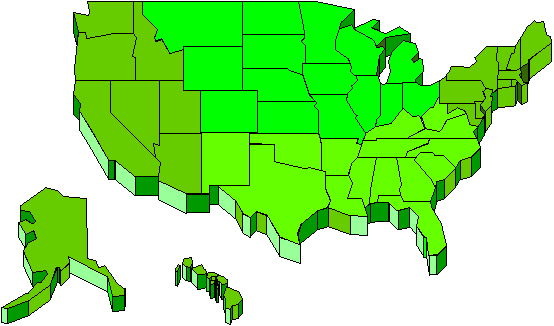
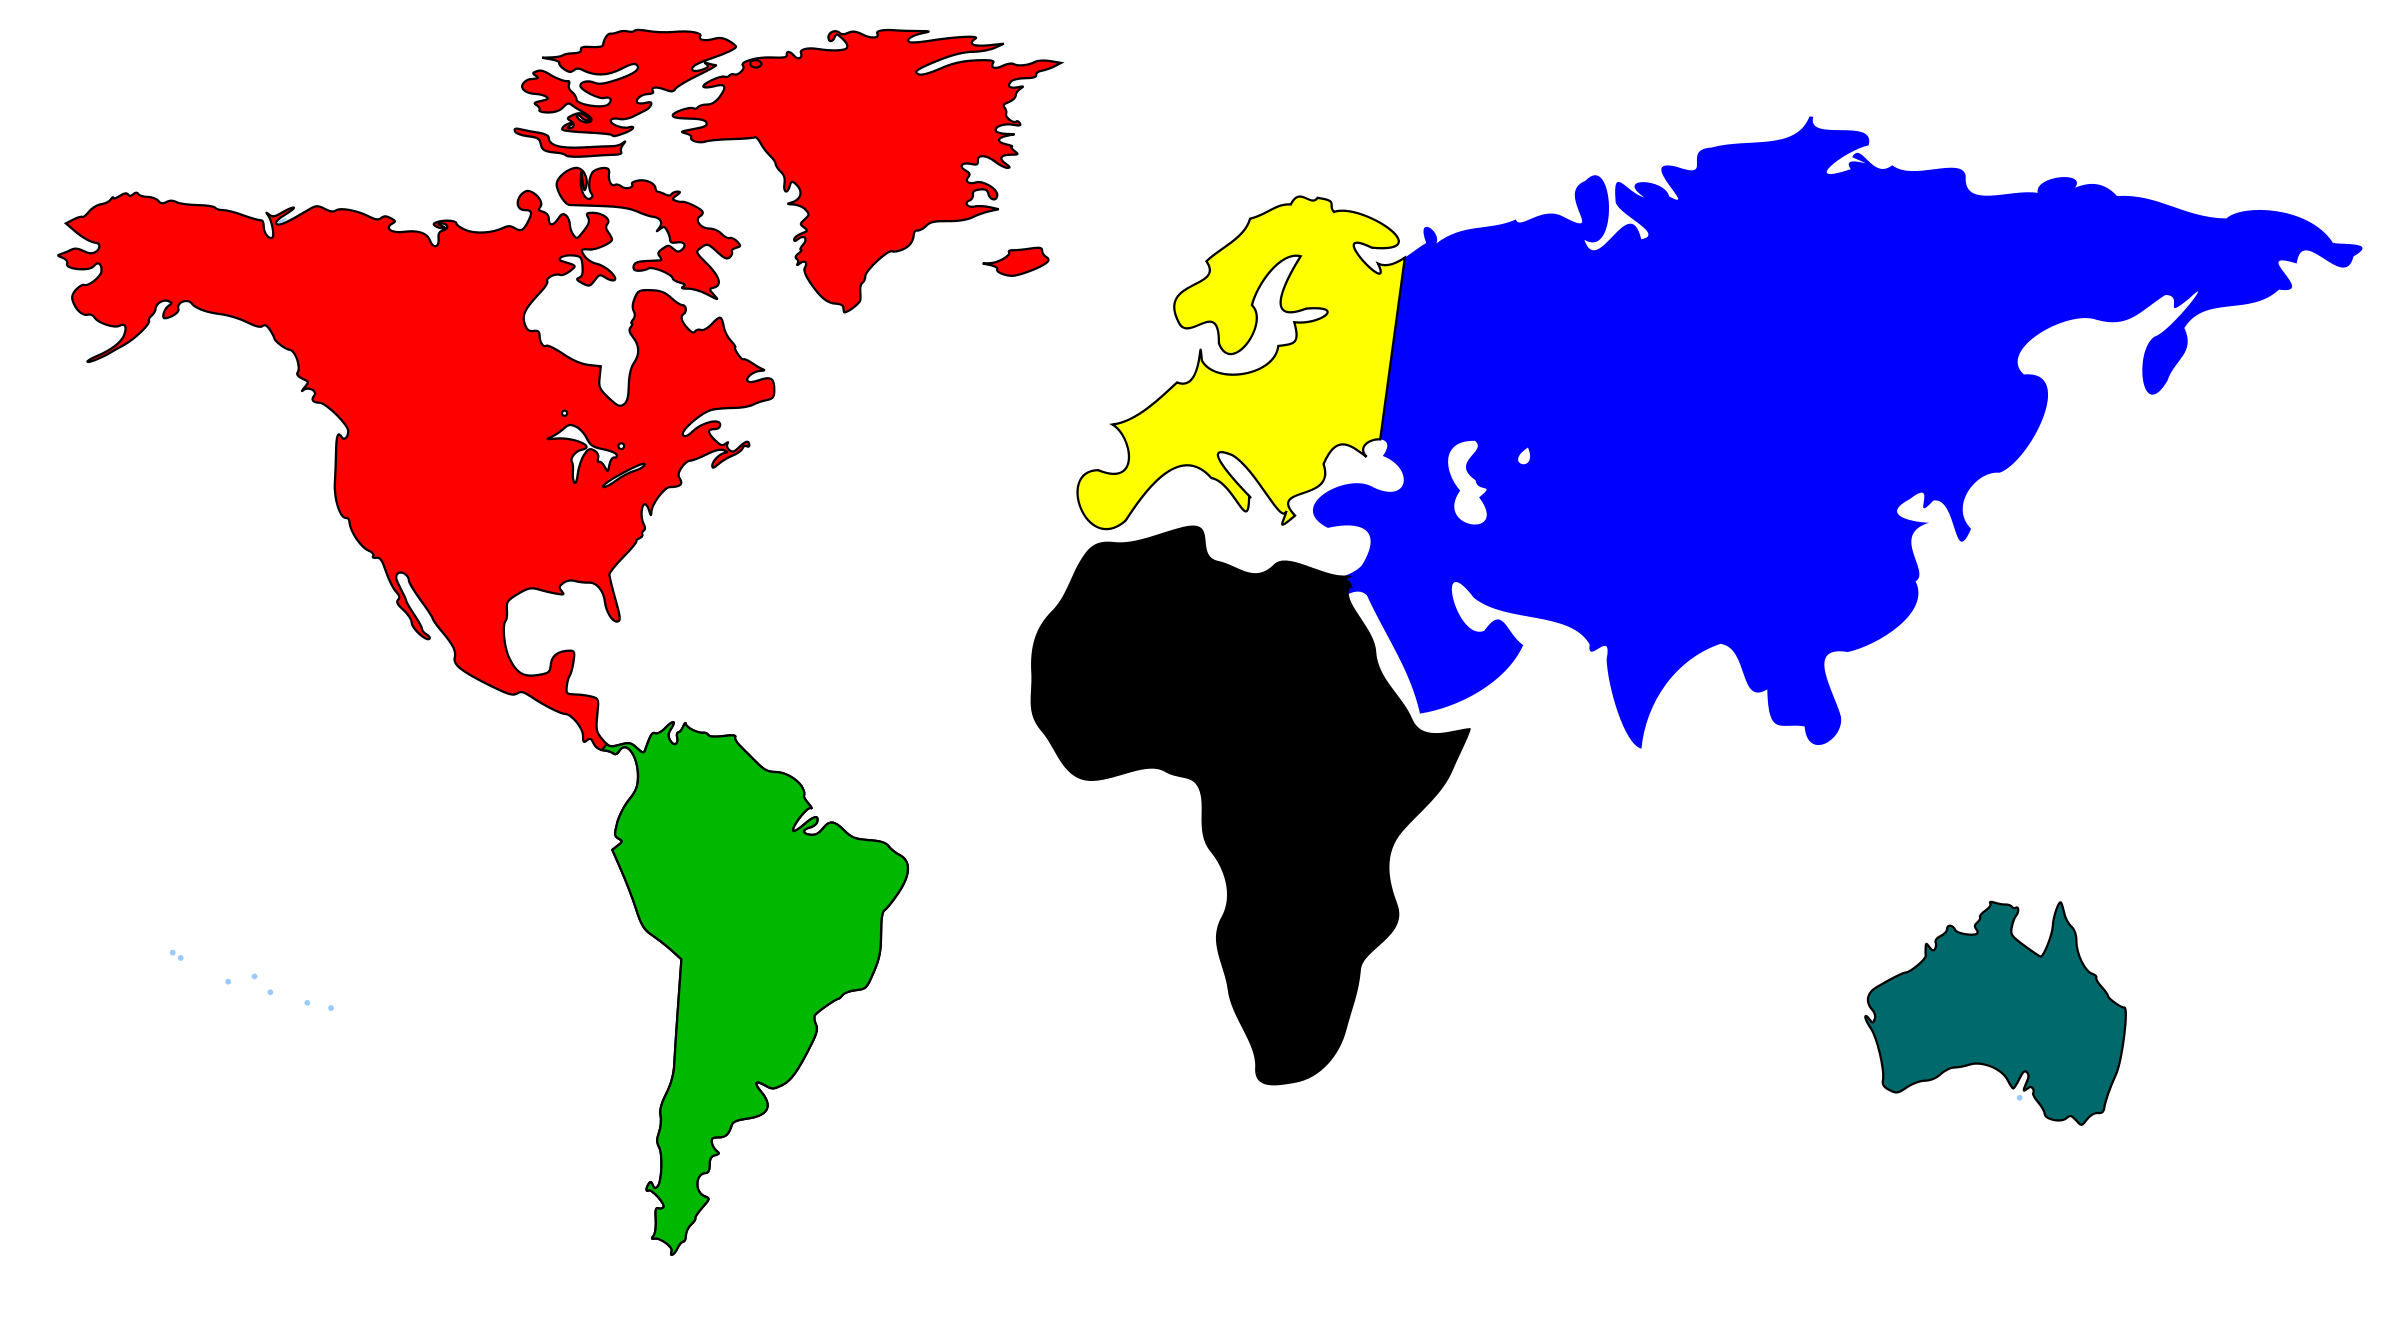
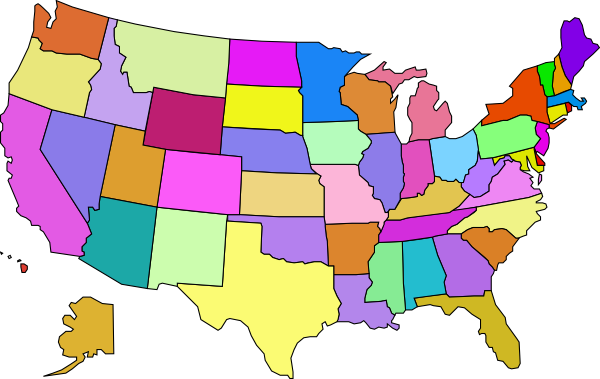
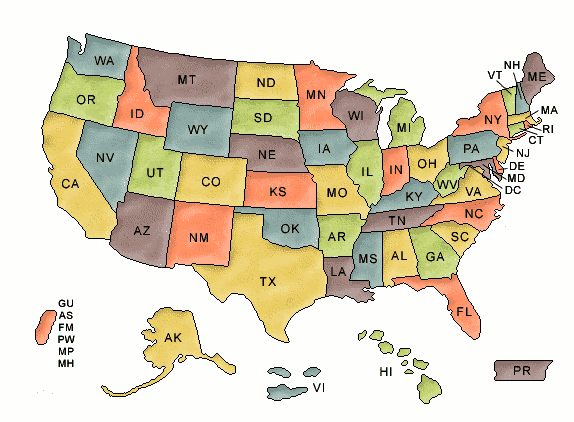
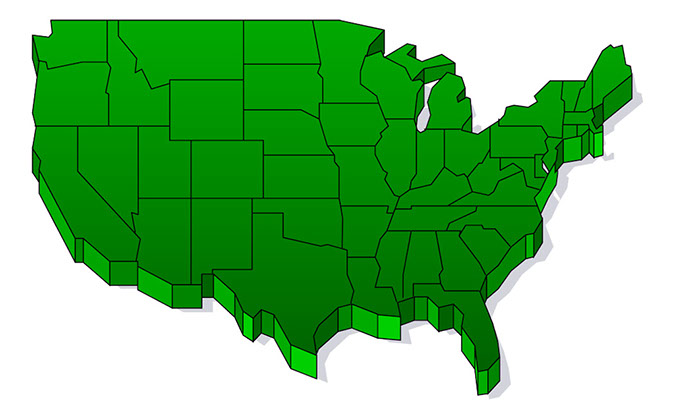
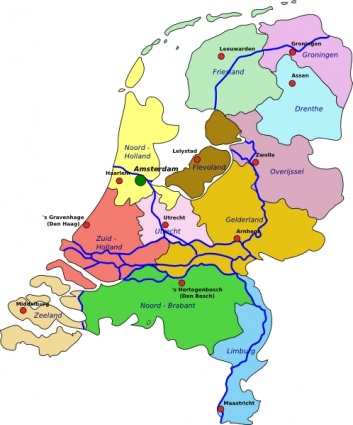
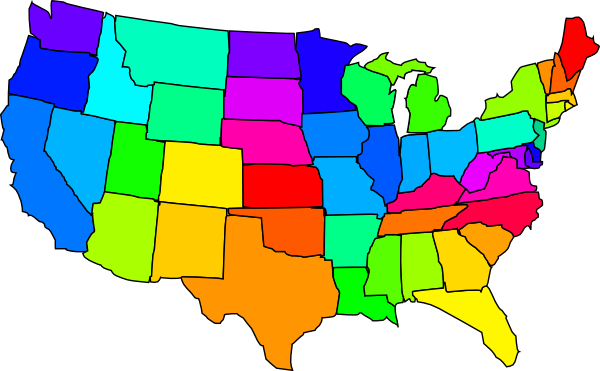
Political Maps – Political maps show borders, capitals, and major cities within countries and regions. They focus on the boundaries and divisions between political entities like countries, states, and provinces. These maps help people understand political geography.
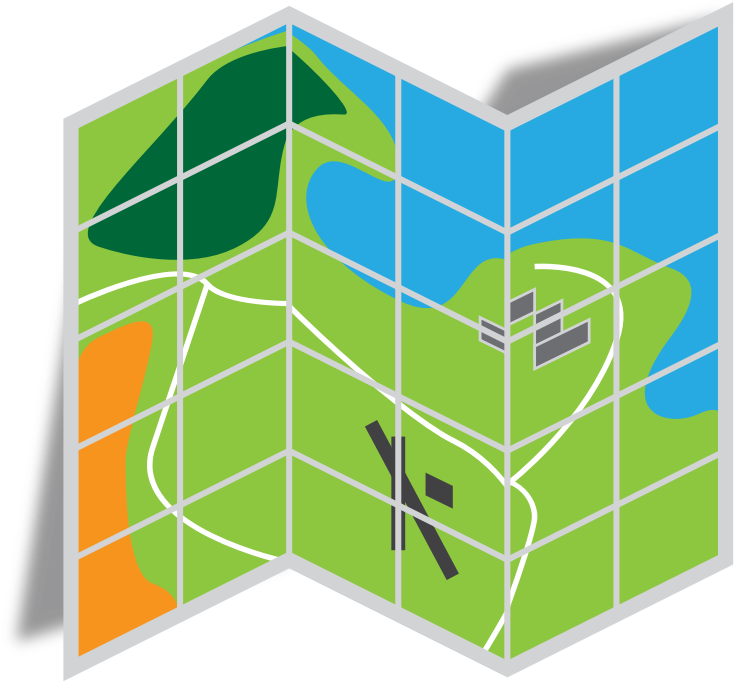
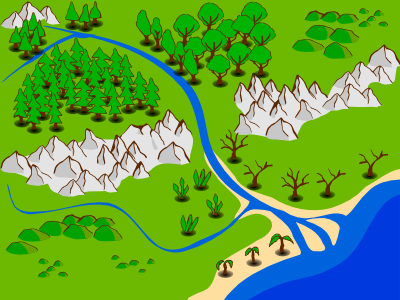
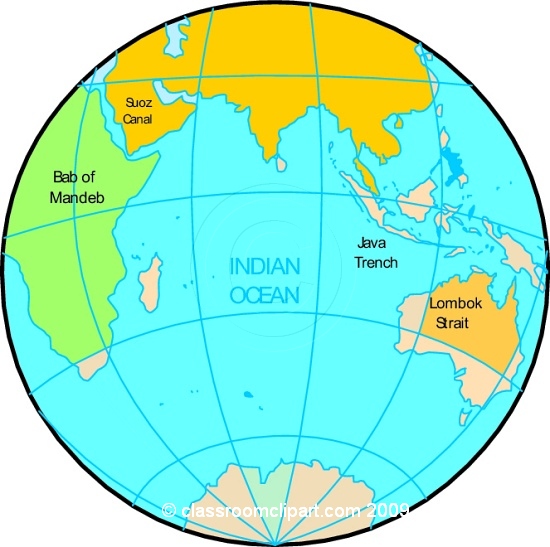
Physical Maps – Physical maps illustrate the natural landscape, including rivers, lakes, mountains, vegetation, and landforms. They show features like elevations, roads, and bodies of water. Physical maps are useful for understanding terrain, ecology, and geography’s impact on human activity.
Thematic Maps – Thematic maps emphasize specific data and topics within a geographic area to highlight spatial patterns and connections. Examples include population density maps, climate maps, economic activity maps, and election result maps. Thematic maps visualize how a phenomenon varies across an area.
Map Elements
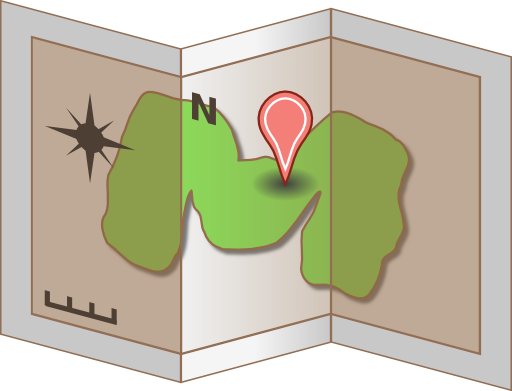
Title – Map titles convey the primary subject and often the location depicted. Titles are placed prominently and help viewers confirm the map’s purpose and extent.
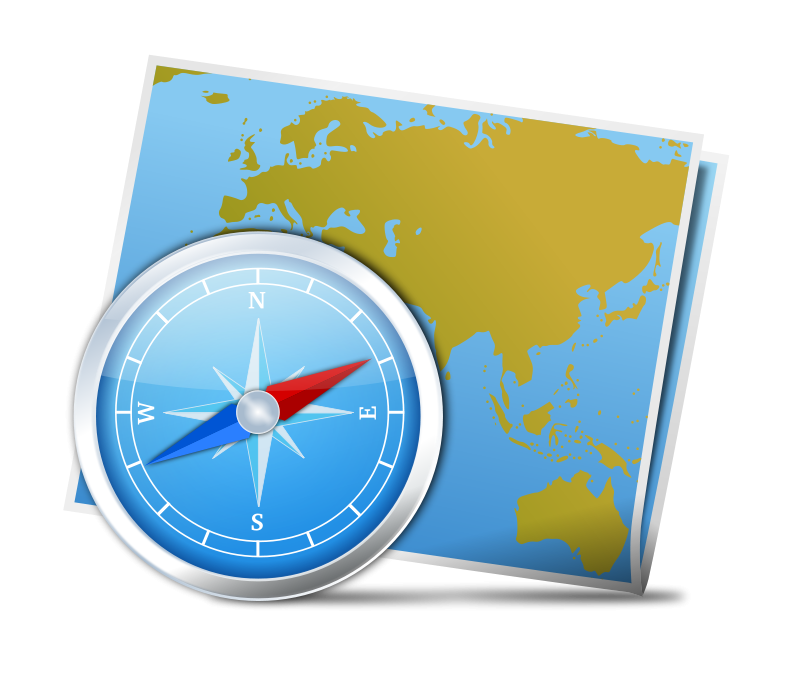
Compass Rose – A compass rose orients the map by showing cardinal directions, usually with a North arrow indicating the direction of true north. Compass roses aid in measuring or describing relative locations.
Scale Bar – Scale bars convert distances on a map to true distances on Earth’s surface. The scale bar is labeled with conversions to common units like kilometers or miles. Scales may vary across different areas of a map.
Legend/Key – A map legend or key explains the meanings of symbols, shadings, lines, or colors used to depict features. Legends help interpret what is shown on the map itself. Complete legends are essential elements for understanding maps.
Map Projections
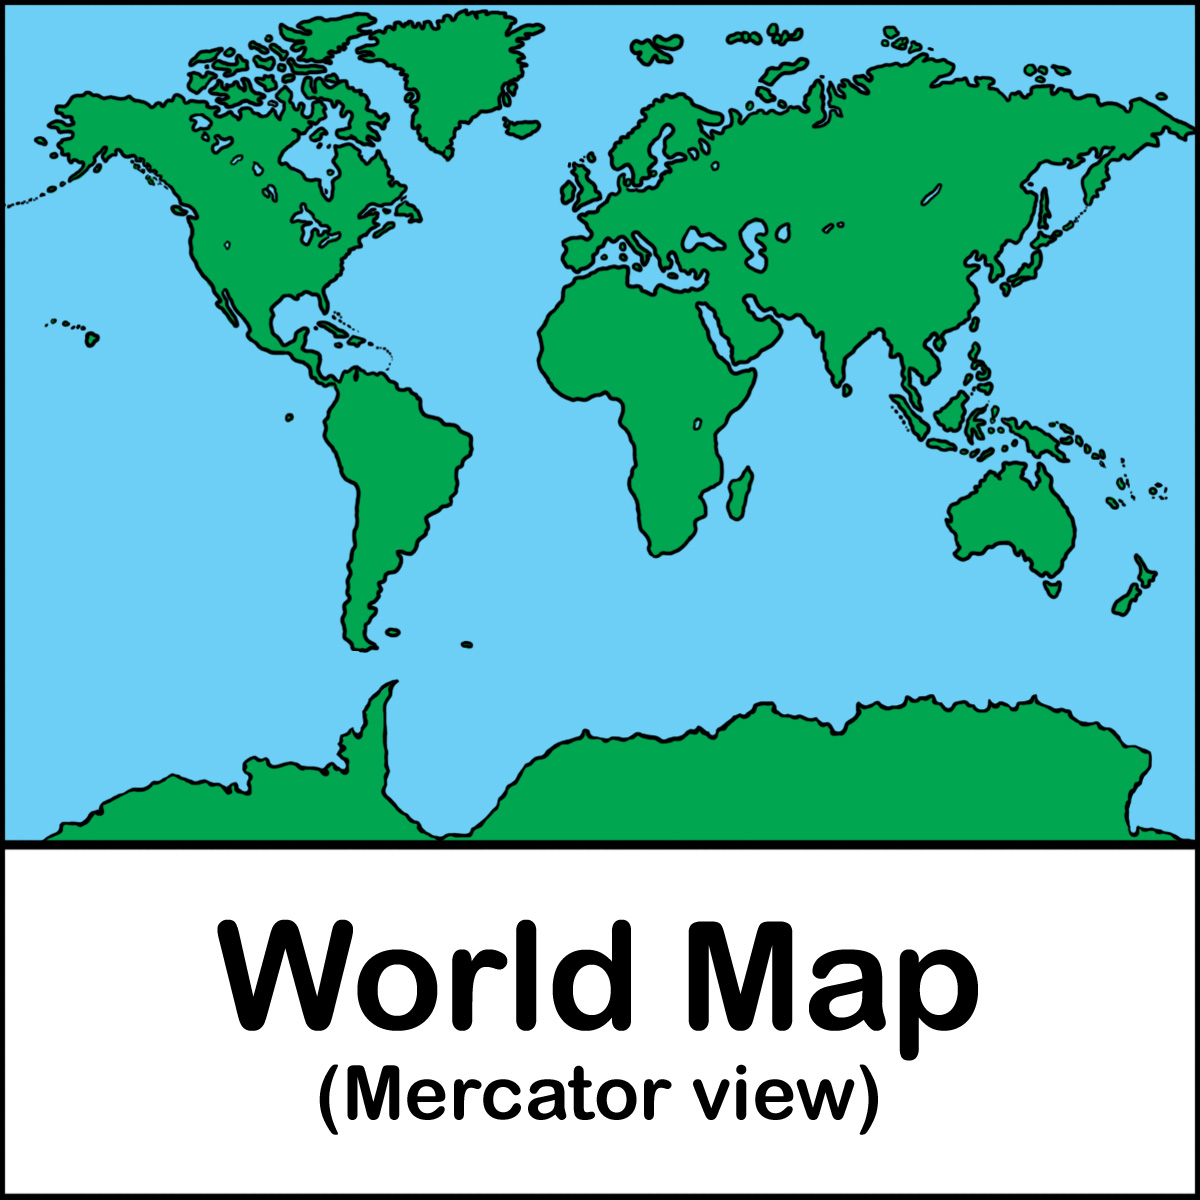
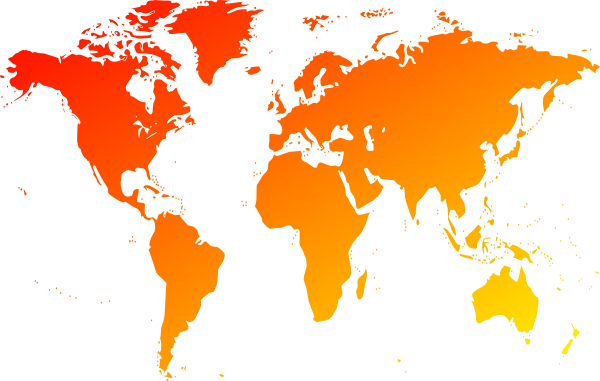
Mercator Projection – The Mercator projection conforms the shapes of land masses but distorts their sizes, especially near the poles. While shapes of land forms are accurate, area sizes increase progressively further from the equator. Mercator is common for navigation charts.
Robinson Projection – The Robinson projection is a compromise between shape and area accuracy. Land masses are only mildly distorted in shape and their areas are plotted proportionally. Robinson strikes a balance as a general world map projection.
Polar Projections – Polar projections are centered on either the North or South pole. They depict the pole accurately while increasingly distorting the shapes and sizes of land masses closer to the map’s outer edges. Polar projections show polar regions accurately.
Digital Maps
Interactivity – Interactive digital maps allow users to pan, zoom, select layers, get pop-up information, and customize the view. Interactive controls engage users and support understanding spatial information.
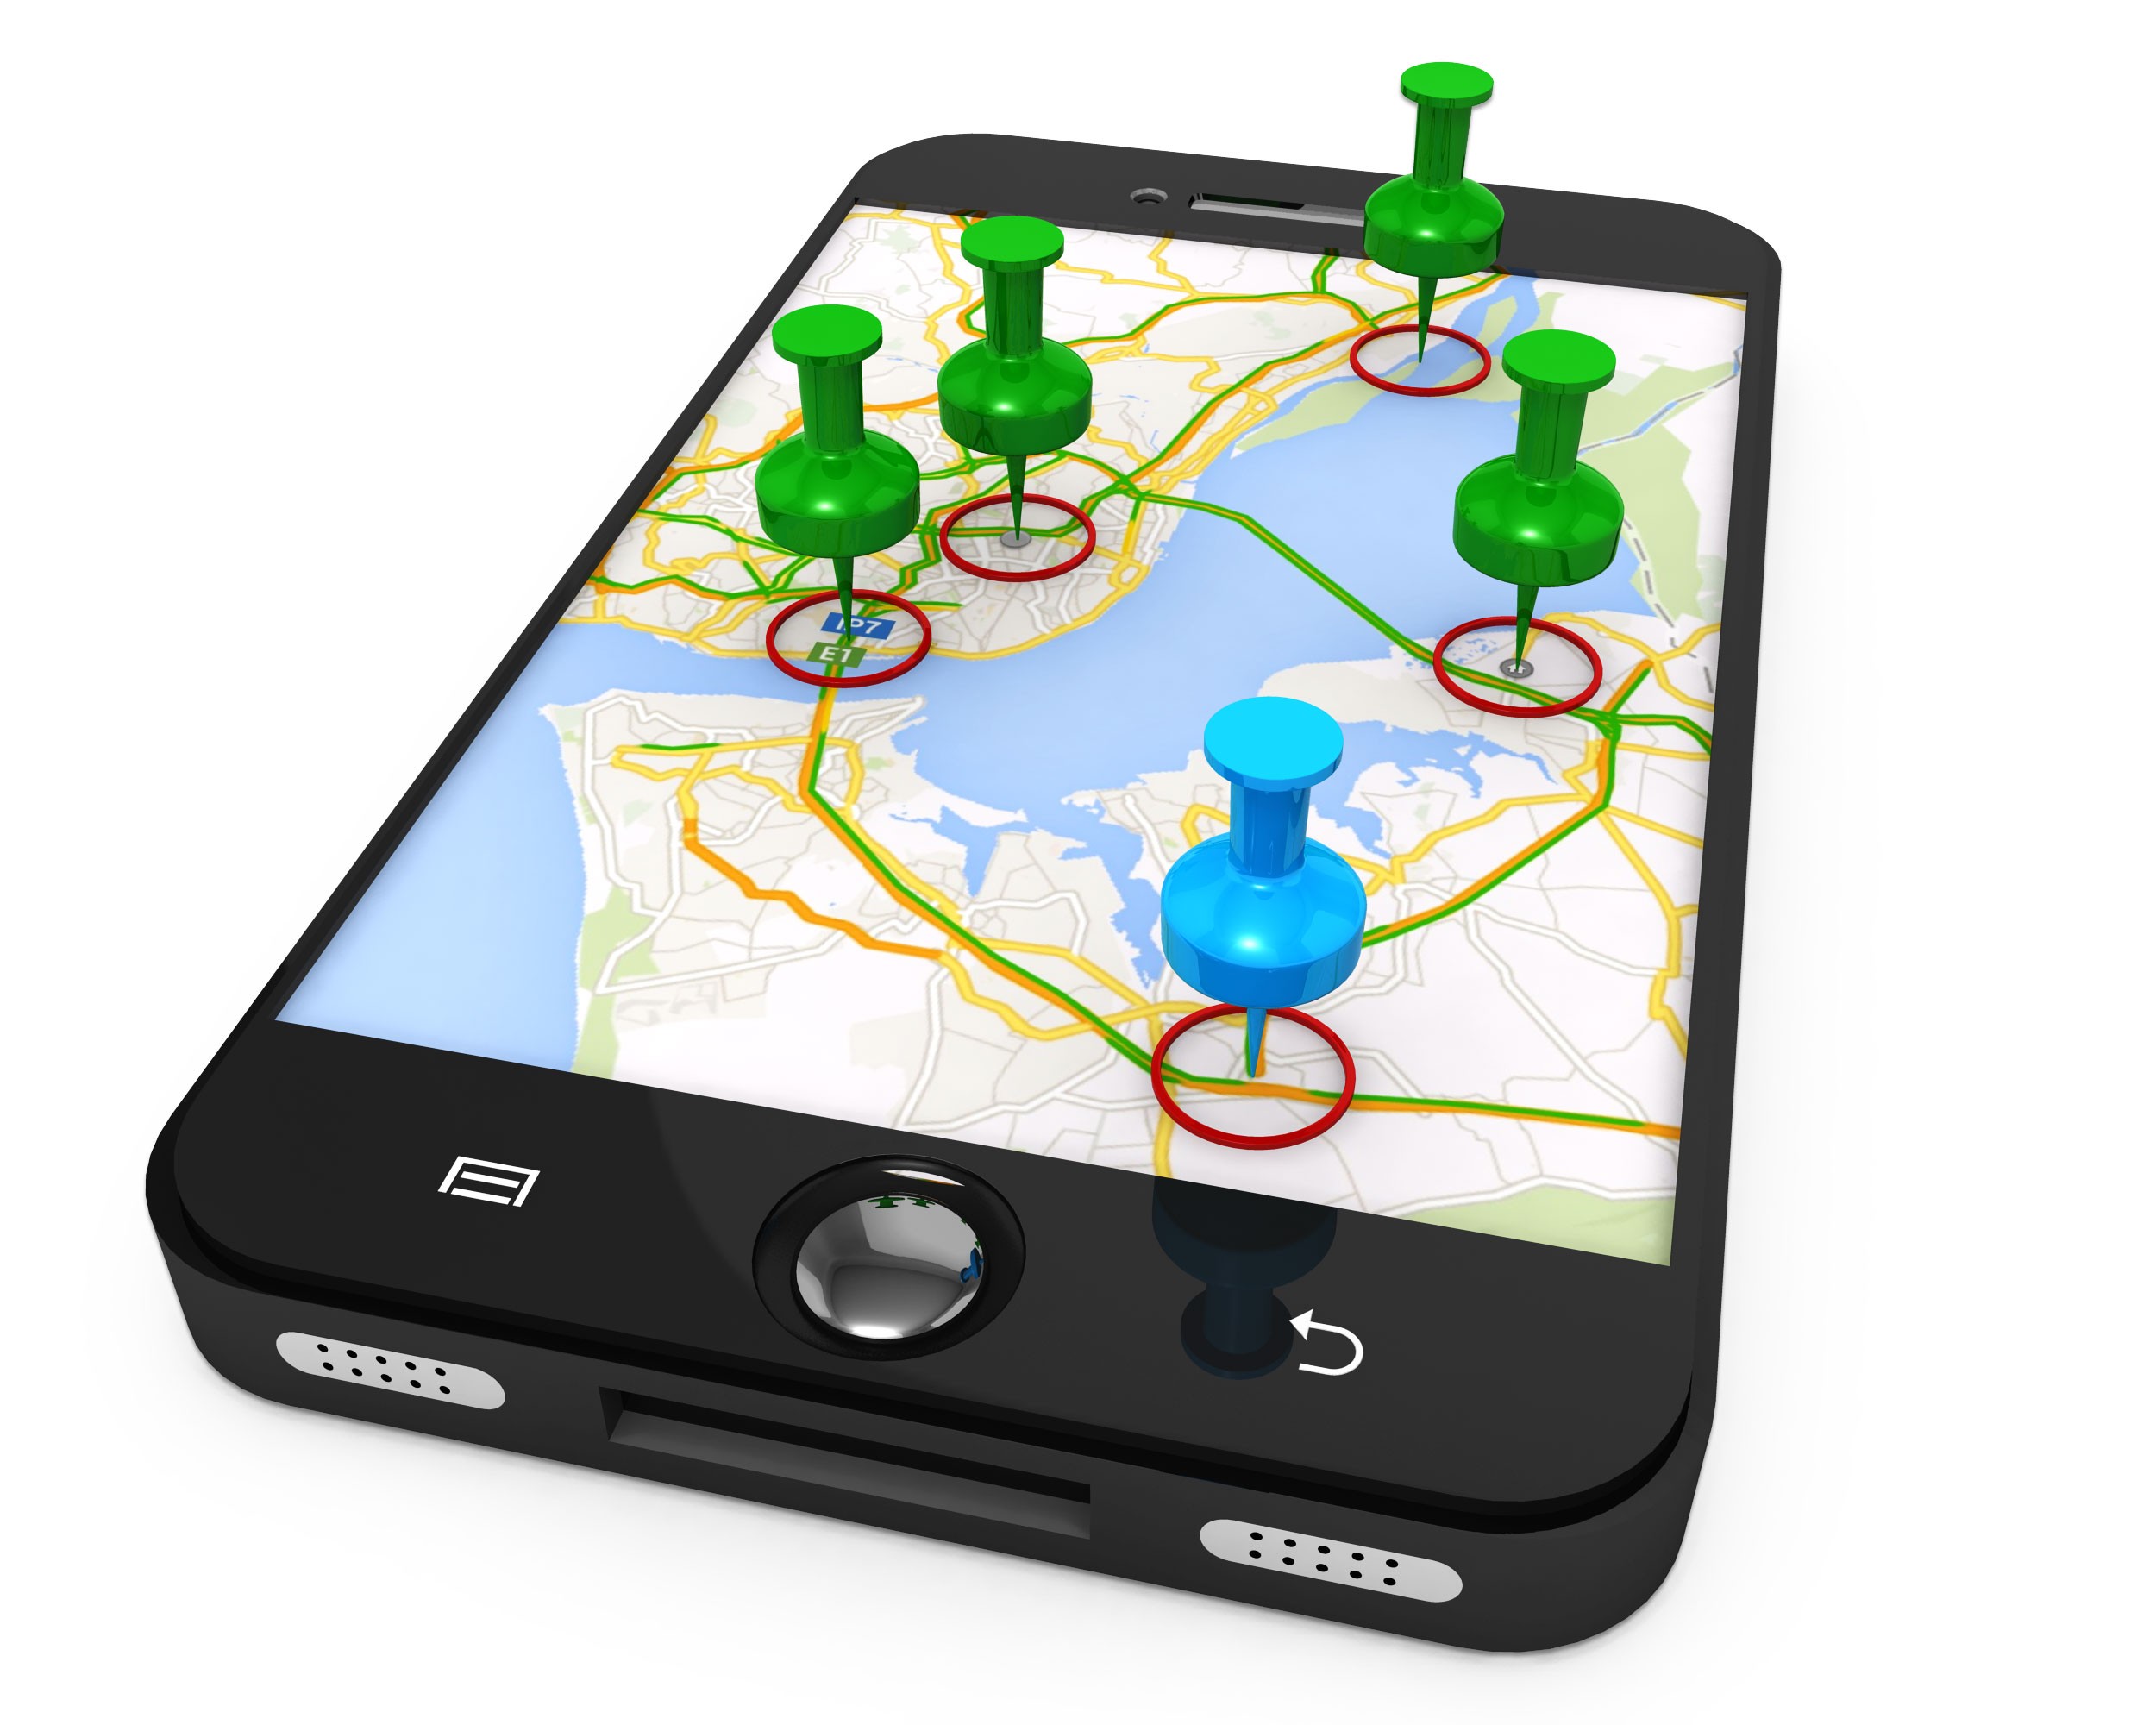
Navigation Mapping – Digital mapping underpins GPS navigation software and devices by showing travel routes overlaid onto road maps. Navigation mapping has expanded access to directions and location awareness.
Data Integration – GIS software enables combining satellite imagery, vector layers showing boundaries, and data sets like population statistics onto base maps. Overlaying diverse data sources yields insights into spatial patterns and trends.
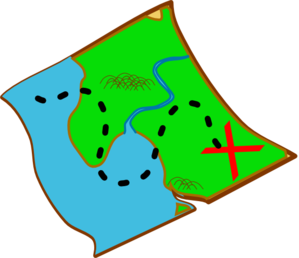
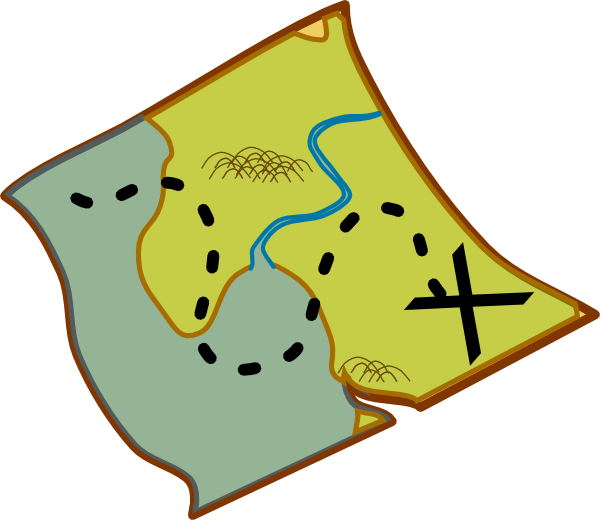
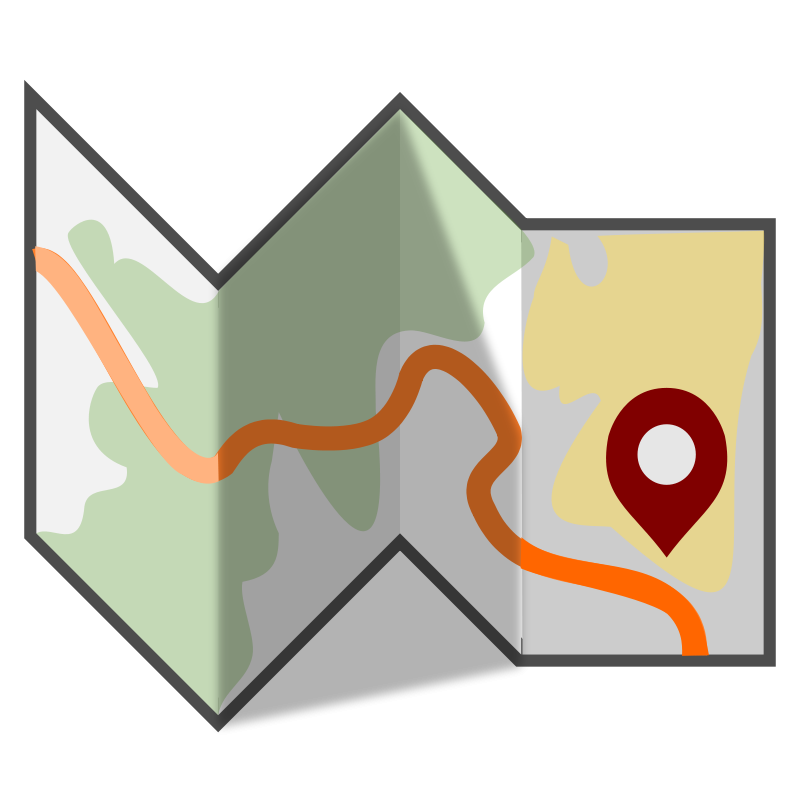
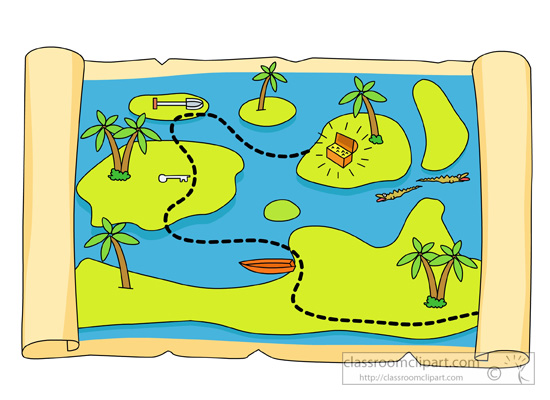
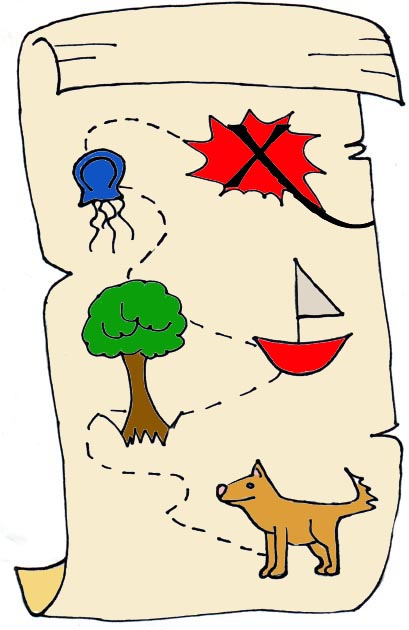
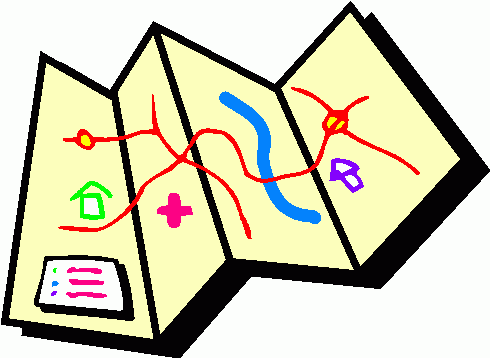
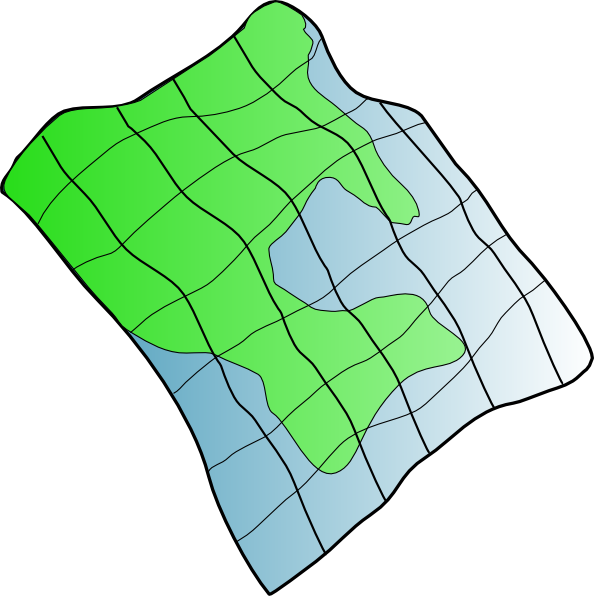
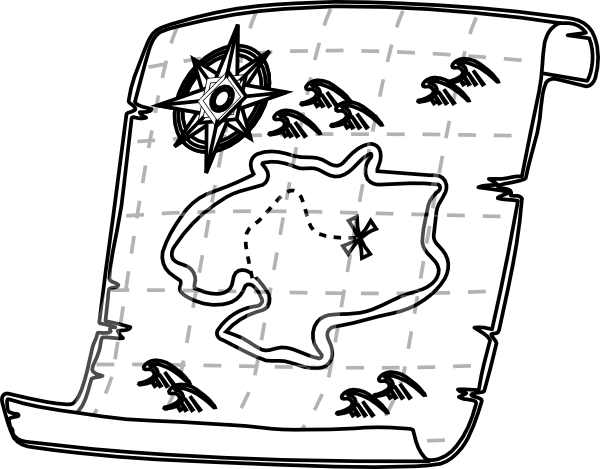
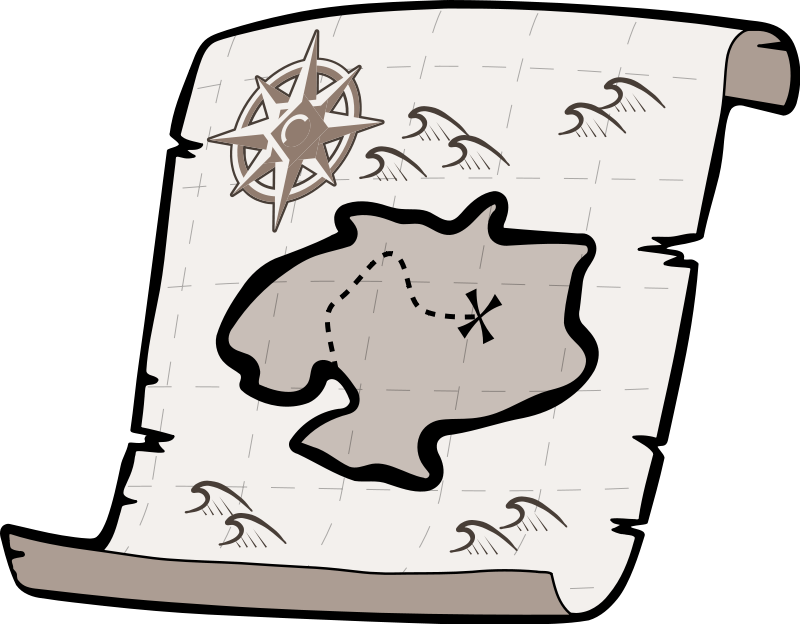
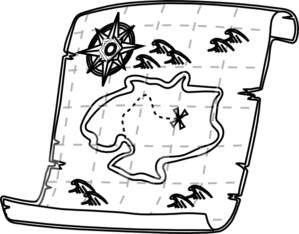
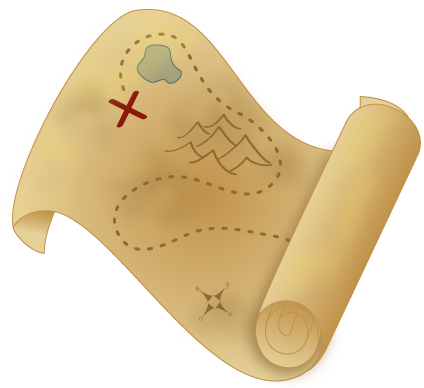
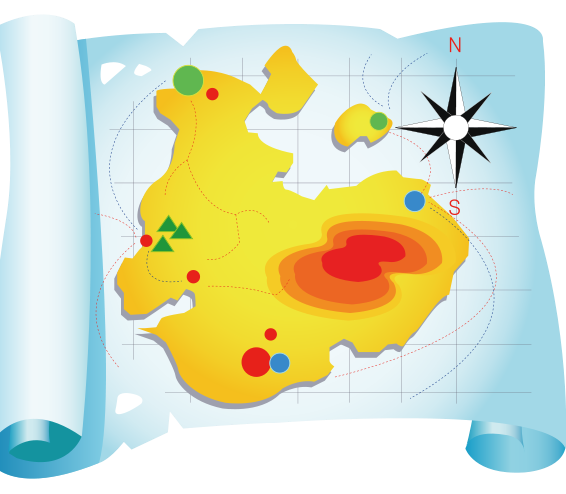
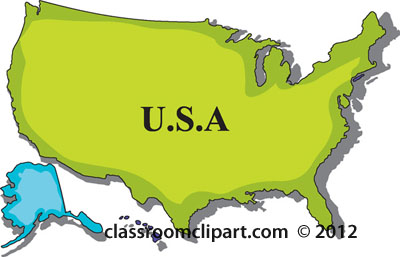
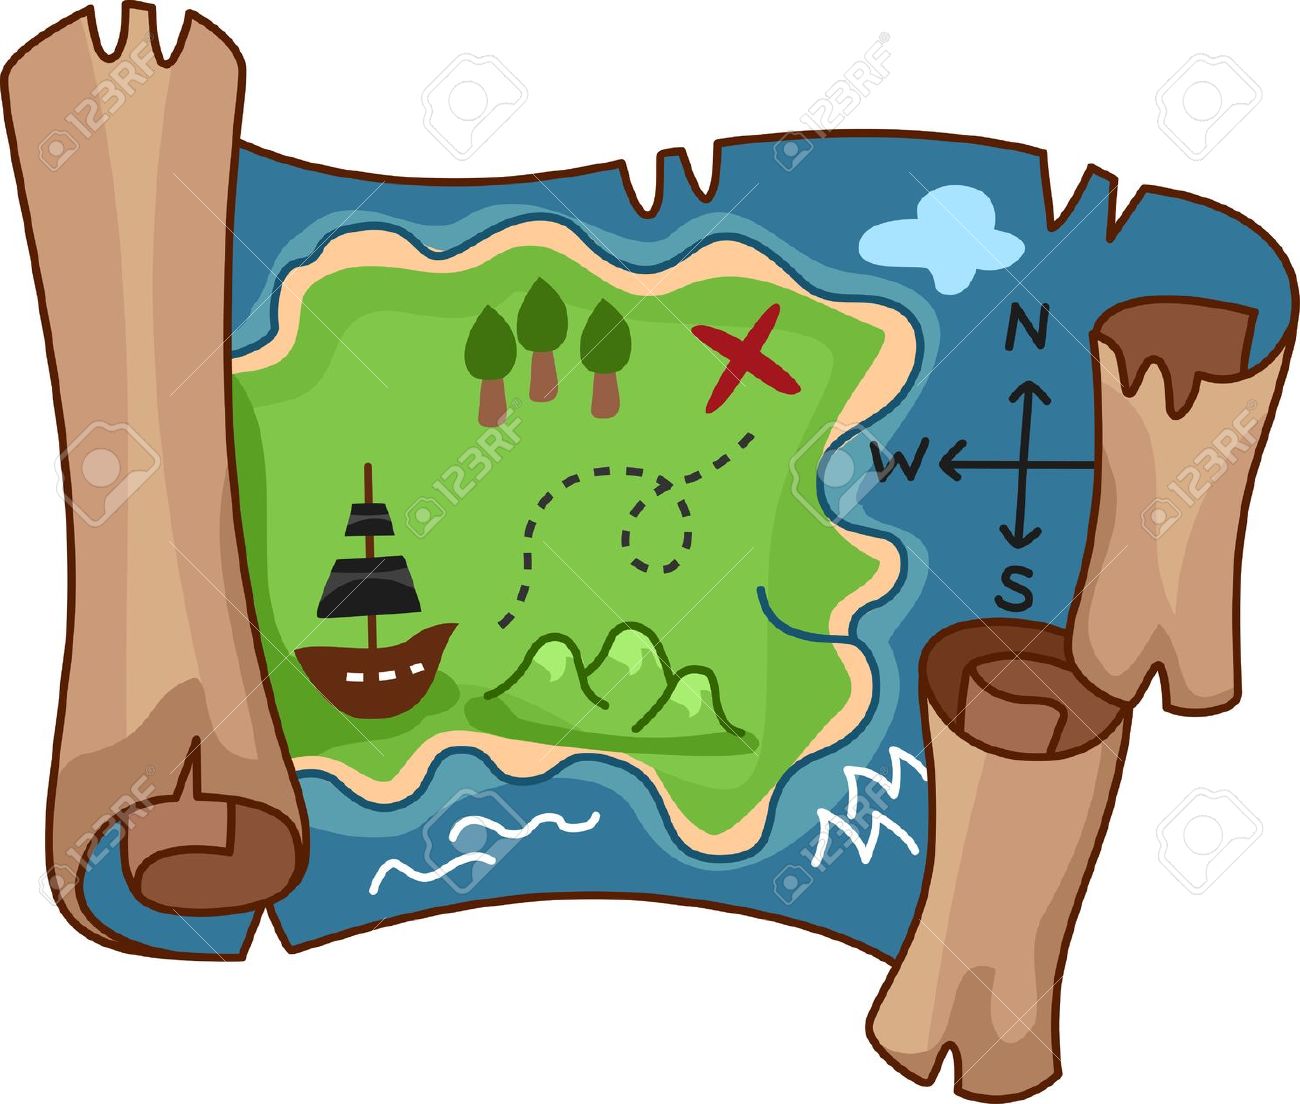
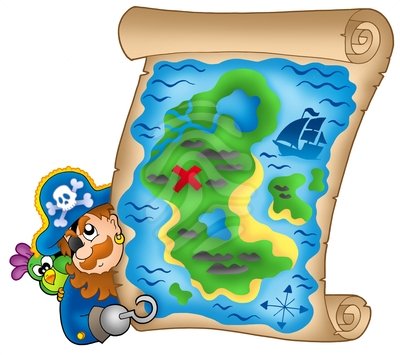
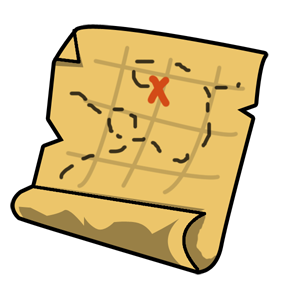
Map Clip Art
Illustrative Symbols – Map clip art includes pre-made illustrations of typical map symbols, such as direction markers, flags, points of interest icons, or means of transportation. These clips add decorative map elements to designs.
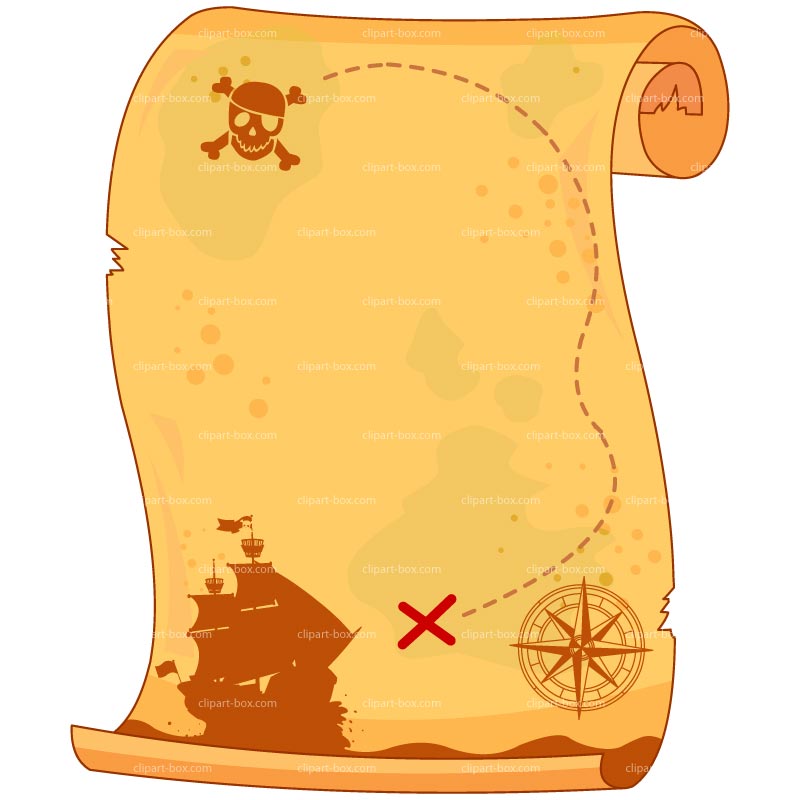
Map Frames – Collections of clip art include reusable map frame shapes such as ribbons, scrolls, medallions, and compass roses to hold maps. Varied map frames suit different aesthetic needs.
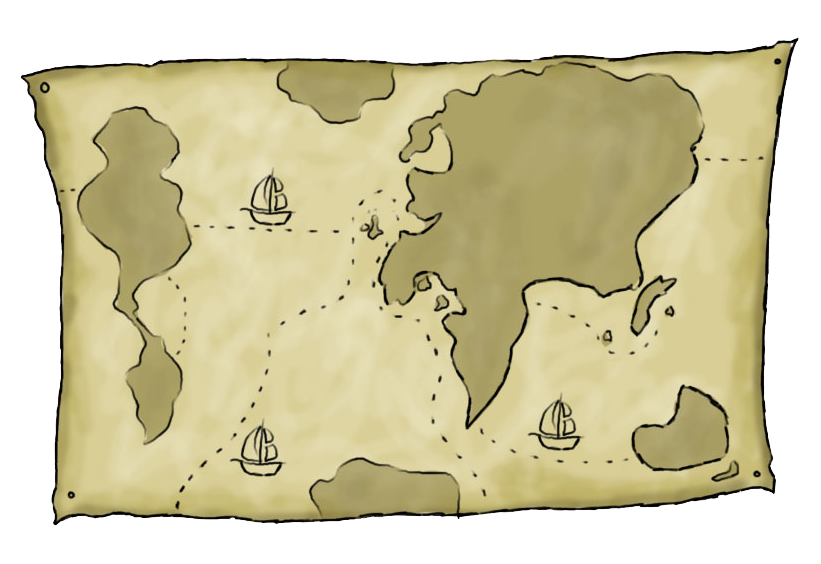
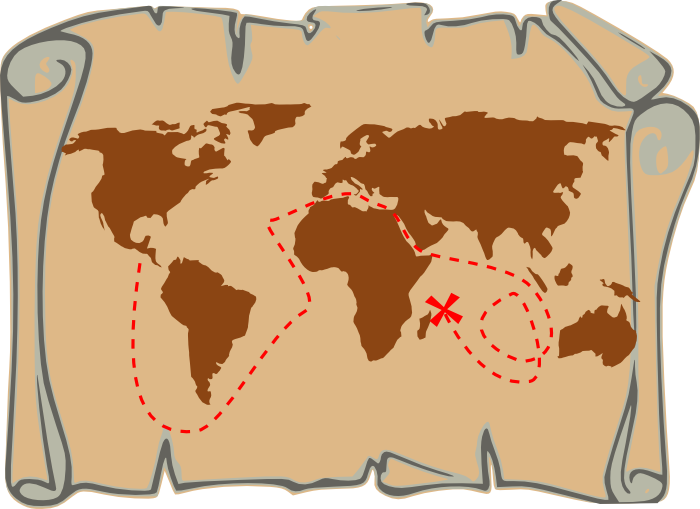
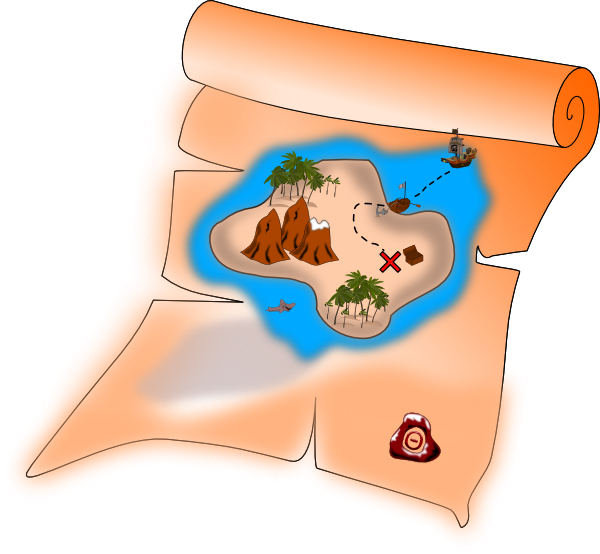
Map Styles – Clip art map styles range from simple sketches, to antique engraved illustrations, to cartoon maps with playful textures. This variety helps creatives match a map’s artistic form to the desired tone and medium.
Using Maps in Design
Infographics – Infographics combine maps with data visualizations, timelines, illustrations, and text to communicate complex information clearly. Underlaying statistics onto maps conveys geographic insight.
Presentation Slides – Maps orient audiences to the location relevant for presentations about research findings, business expansion plans, or event convenings. Locator maps add clarity for public speaking.
Reports and Analysis – Spatial data analysis can reveal trends as maps highlight patterns in variables across different areas and segments. Mapping statistical findings improves cognition of analytical reports.
Interactive Maps
Clickable Maps – Interactive clickable maps enable users to hover and select pinned locations to get embedded data and context. Exploring highlights insights into site-specific characteristics.
Time-Lapse Maps – Animated and time-enabled maps show how spatial data changes over time by sequencing layers showing movement, growth, or other time-based phenomena. Their motion illustrates change.
Storymaps
Storymaps interweave interactive scrolling maps with explanatory text, images, and multimedia content connected to places. They engage audiences in map-based narratives.
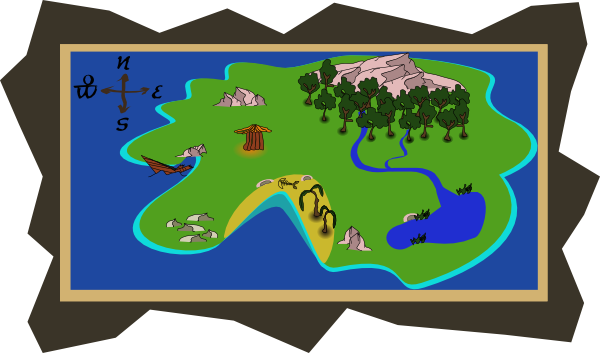
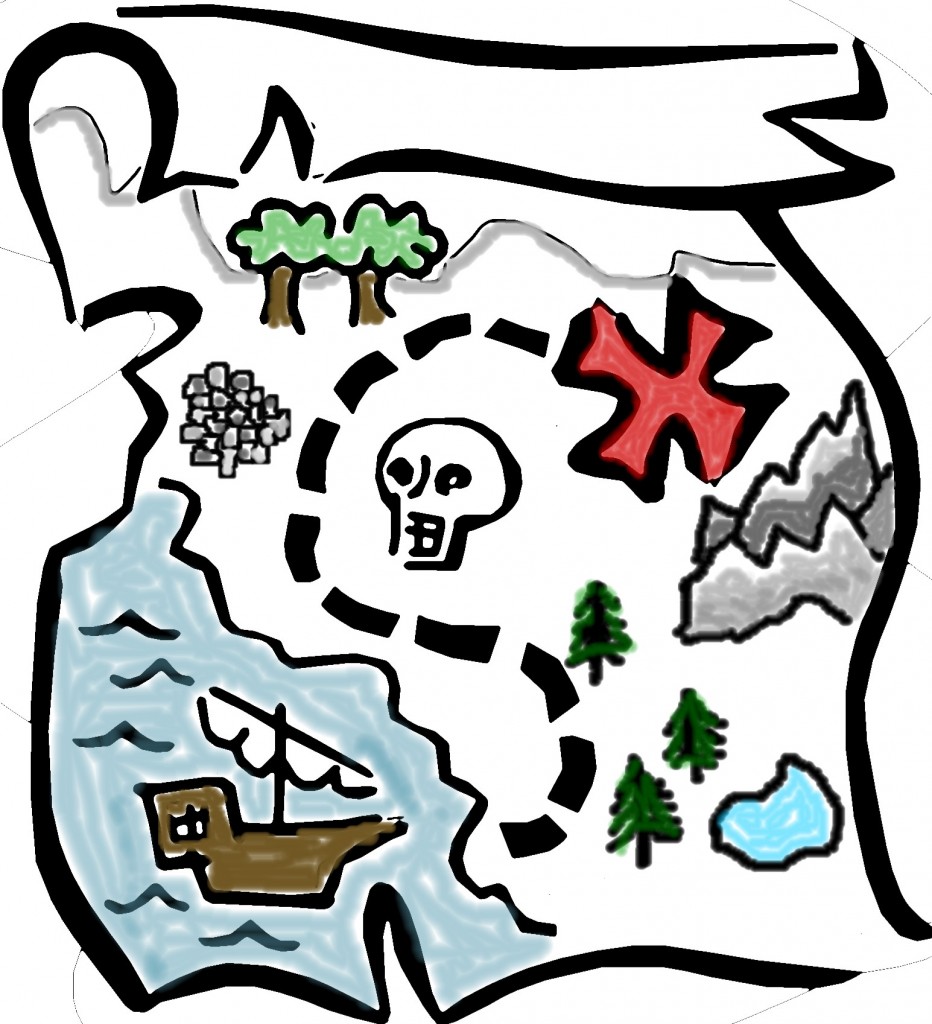
Artistic Maps
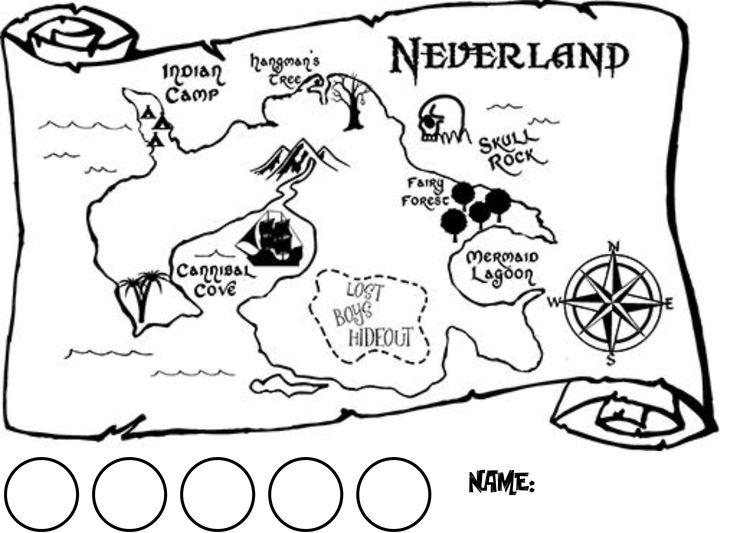
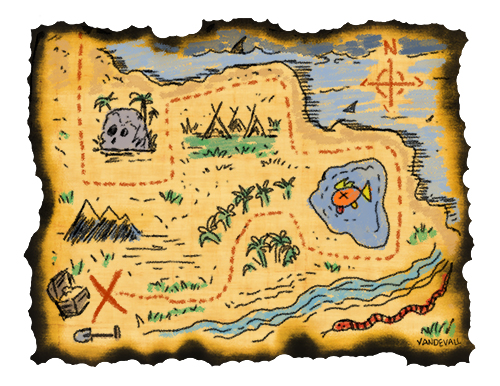
Hand-Drawn Maps – Hand sketched and illustrated maps bend reality for emotional impact. Exaggerating features by hand asserts creative interpretation over geographic accuracy.
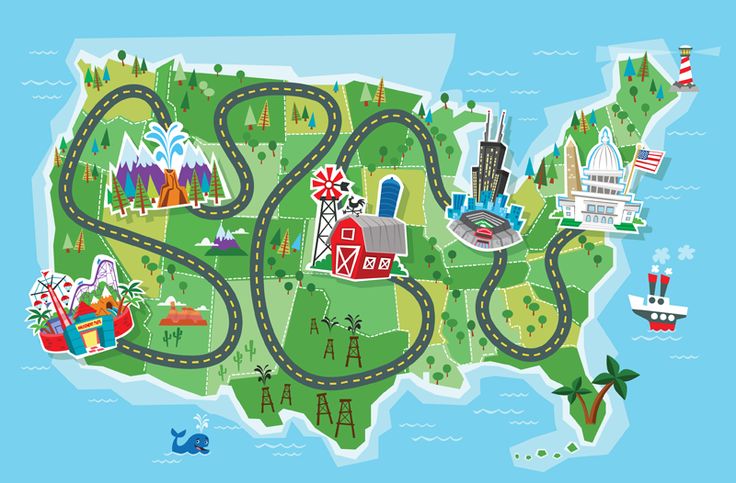
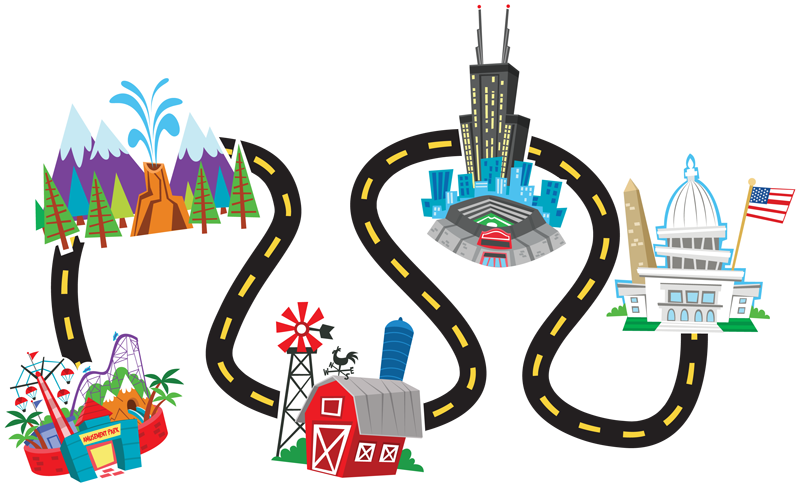
Pictorial Maps – Pictorial maps embellish landscapes with representative drawings and icons evoking cultural associations, often with a playful or promotional aim. They sell a vision of place.
Map Decor – Artfully designed maps and globes adorn homes and offices purely for aesthetic decoration rather than geographic education. They add style as interior design elements.
The Future of Mapping
Global Views – Cloud computing powers online platforms like Google Earth to process satellite imagery for dynamically zoomable global maps unconstrained by data storage limits. This enables expansive new details.
3D Terrains – Digital terrain modeling builds layered maps indicating elevations and vertical features like mountains, canyons, and structures in accurate vertical dimensions for perspective recreational 3D map views.
Augmented Reality – Emerging augmented reality maps overlay location-specific annotations onto live camera views of surroundings on mobile devices. They interweave the digital and material worlds.
In this page clipartix present 73 map clipart images free for designing activities. Lets download Map Clipart that you want to use for works or personal uses.